Modernise your Git experience with
Discover the future of codebase analysis. High-performance Git visualisations, running locally - and right in your browser.
Try it now!
For the best performance, we recommend using a Chromium-based browser.
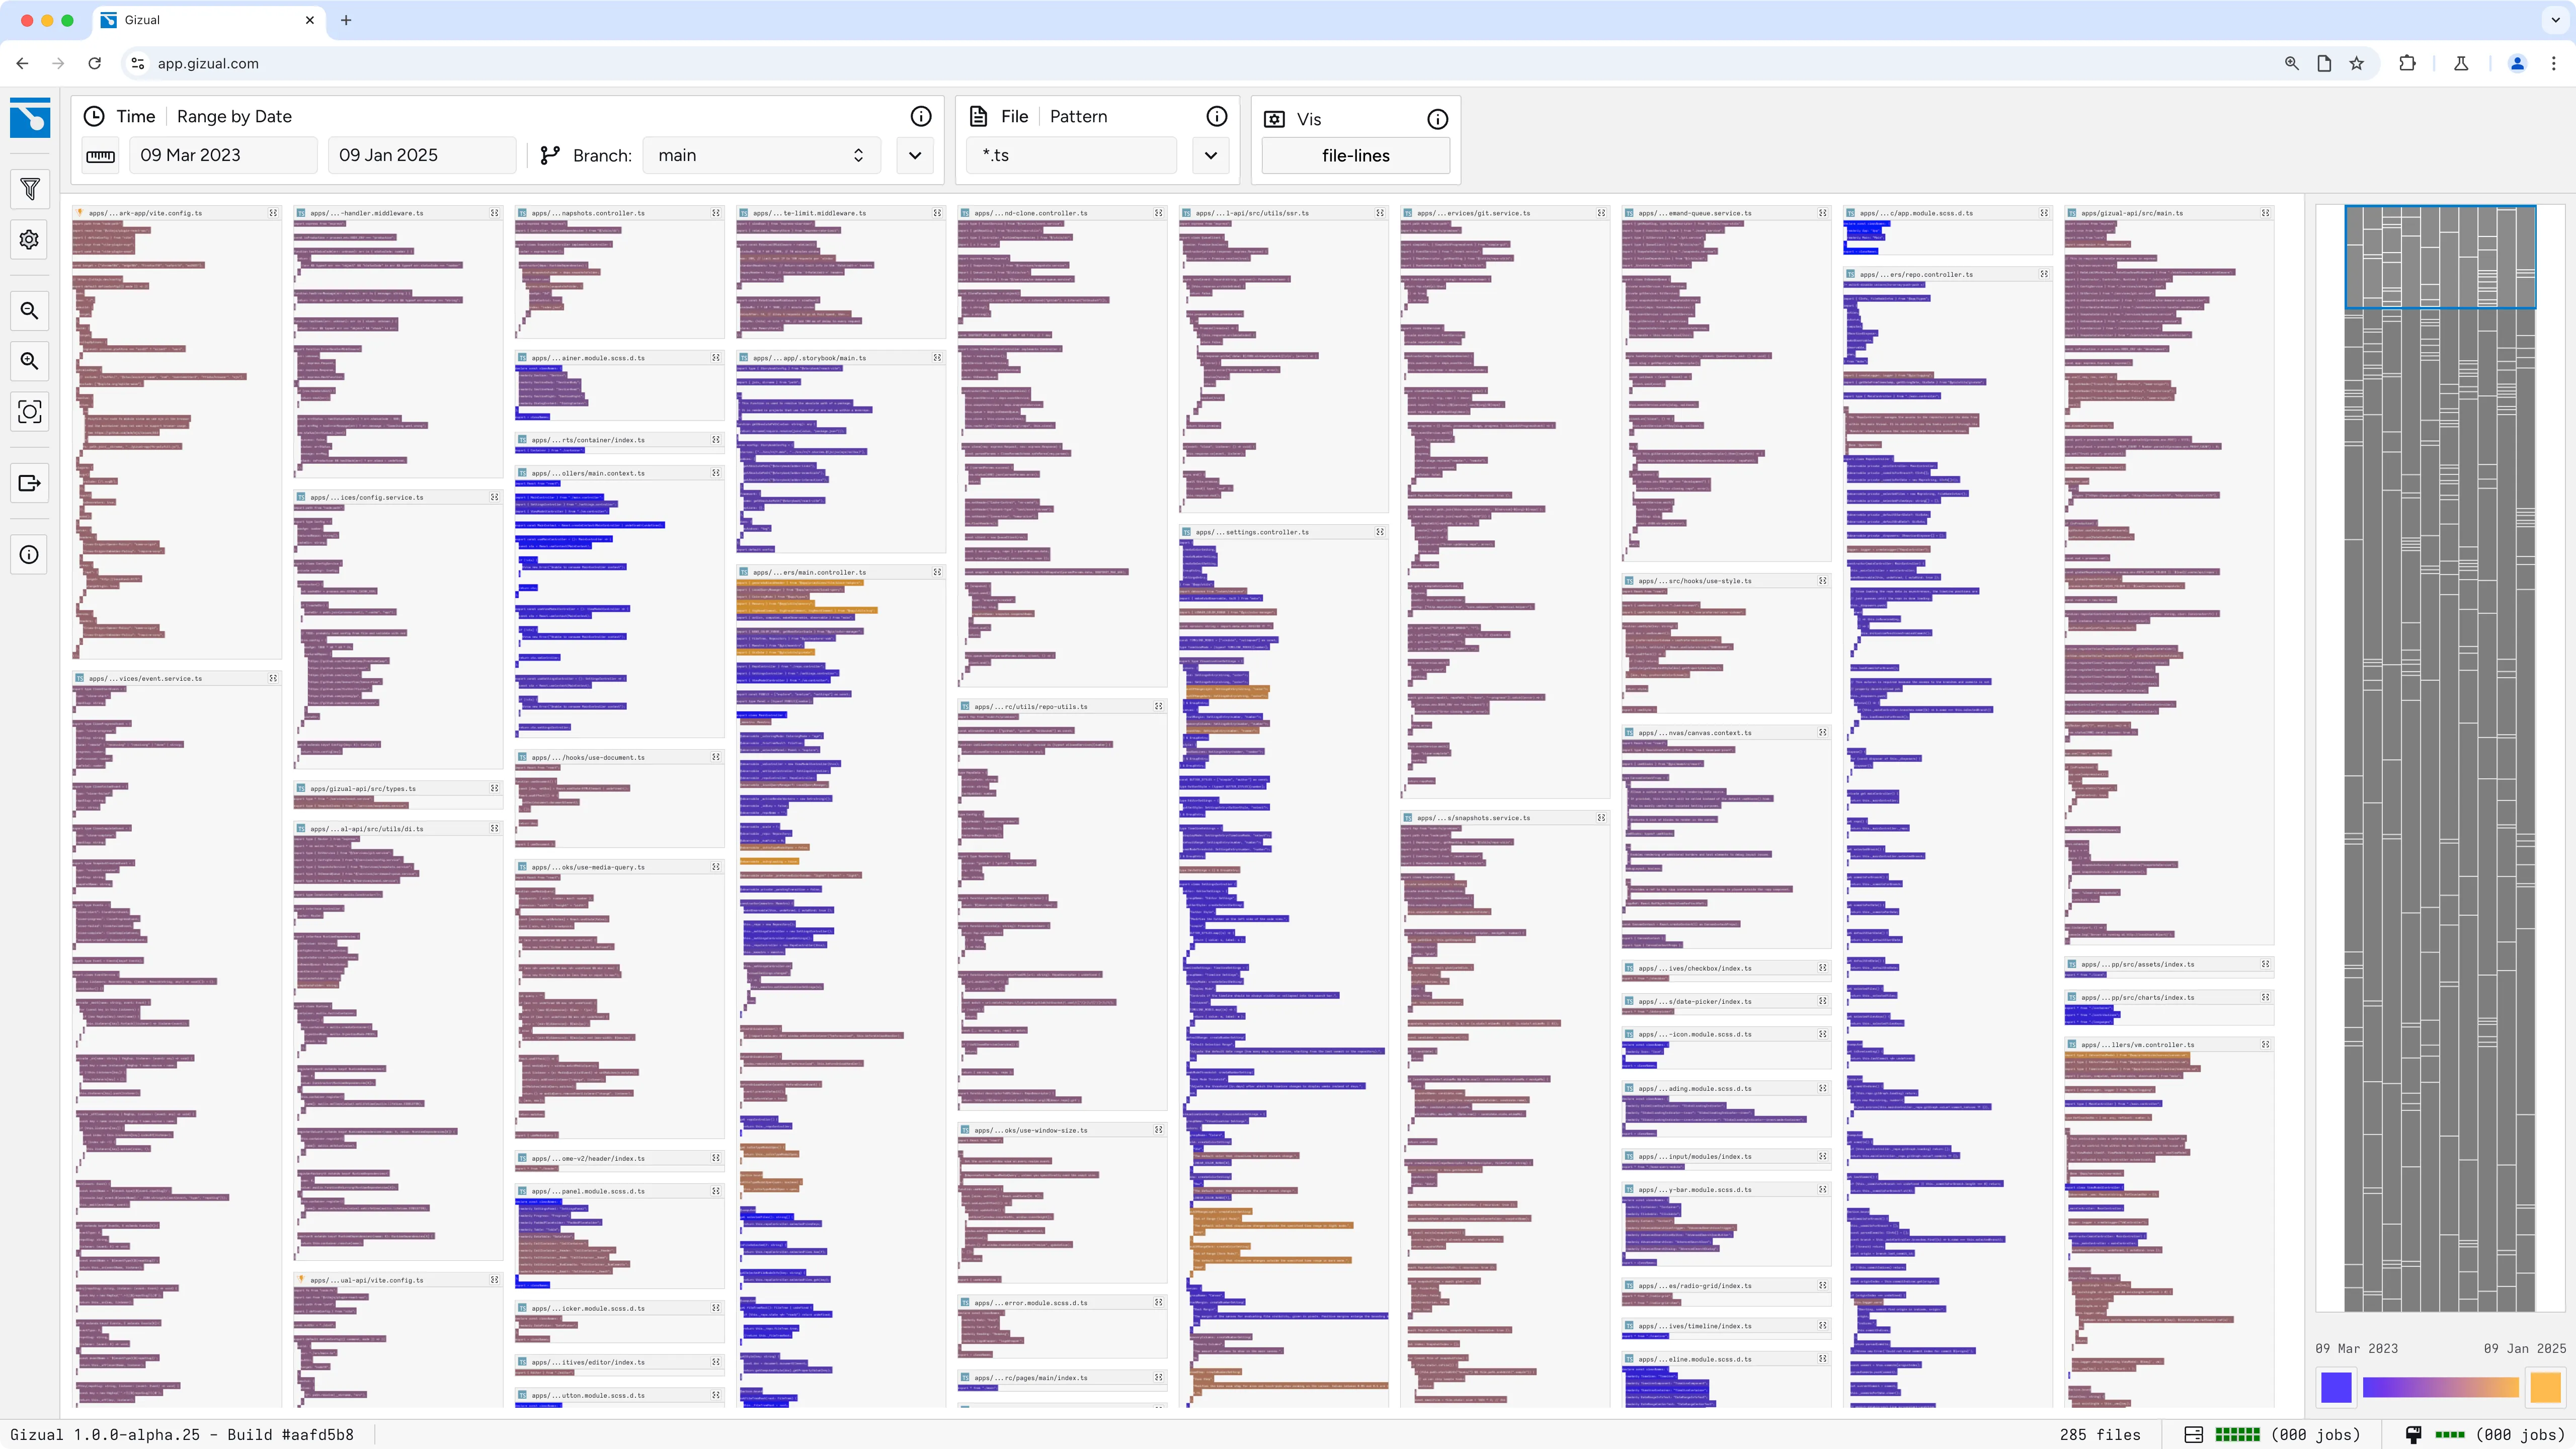
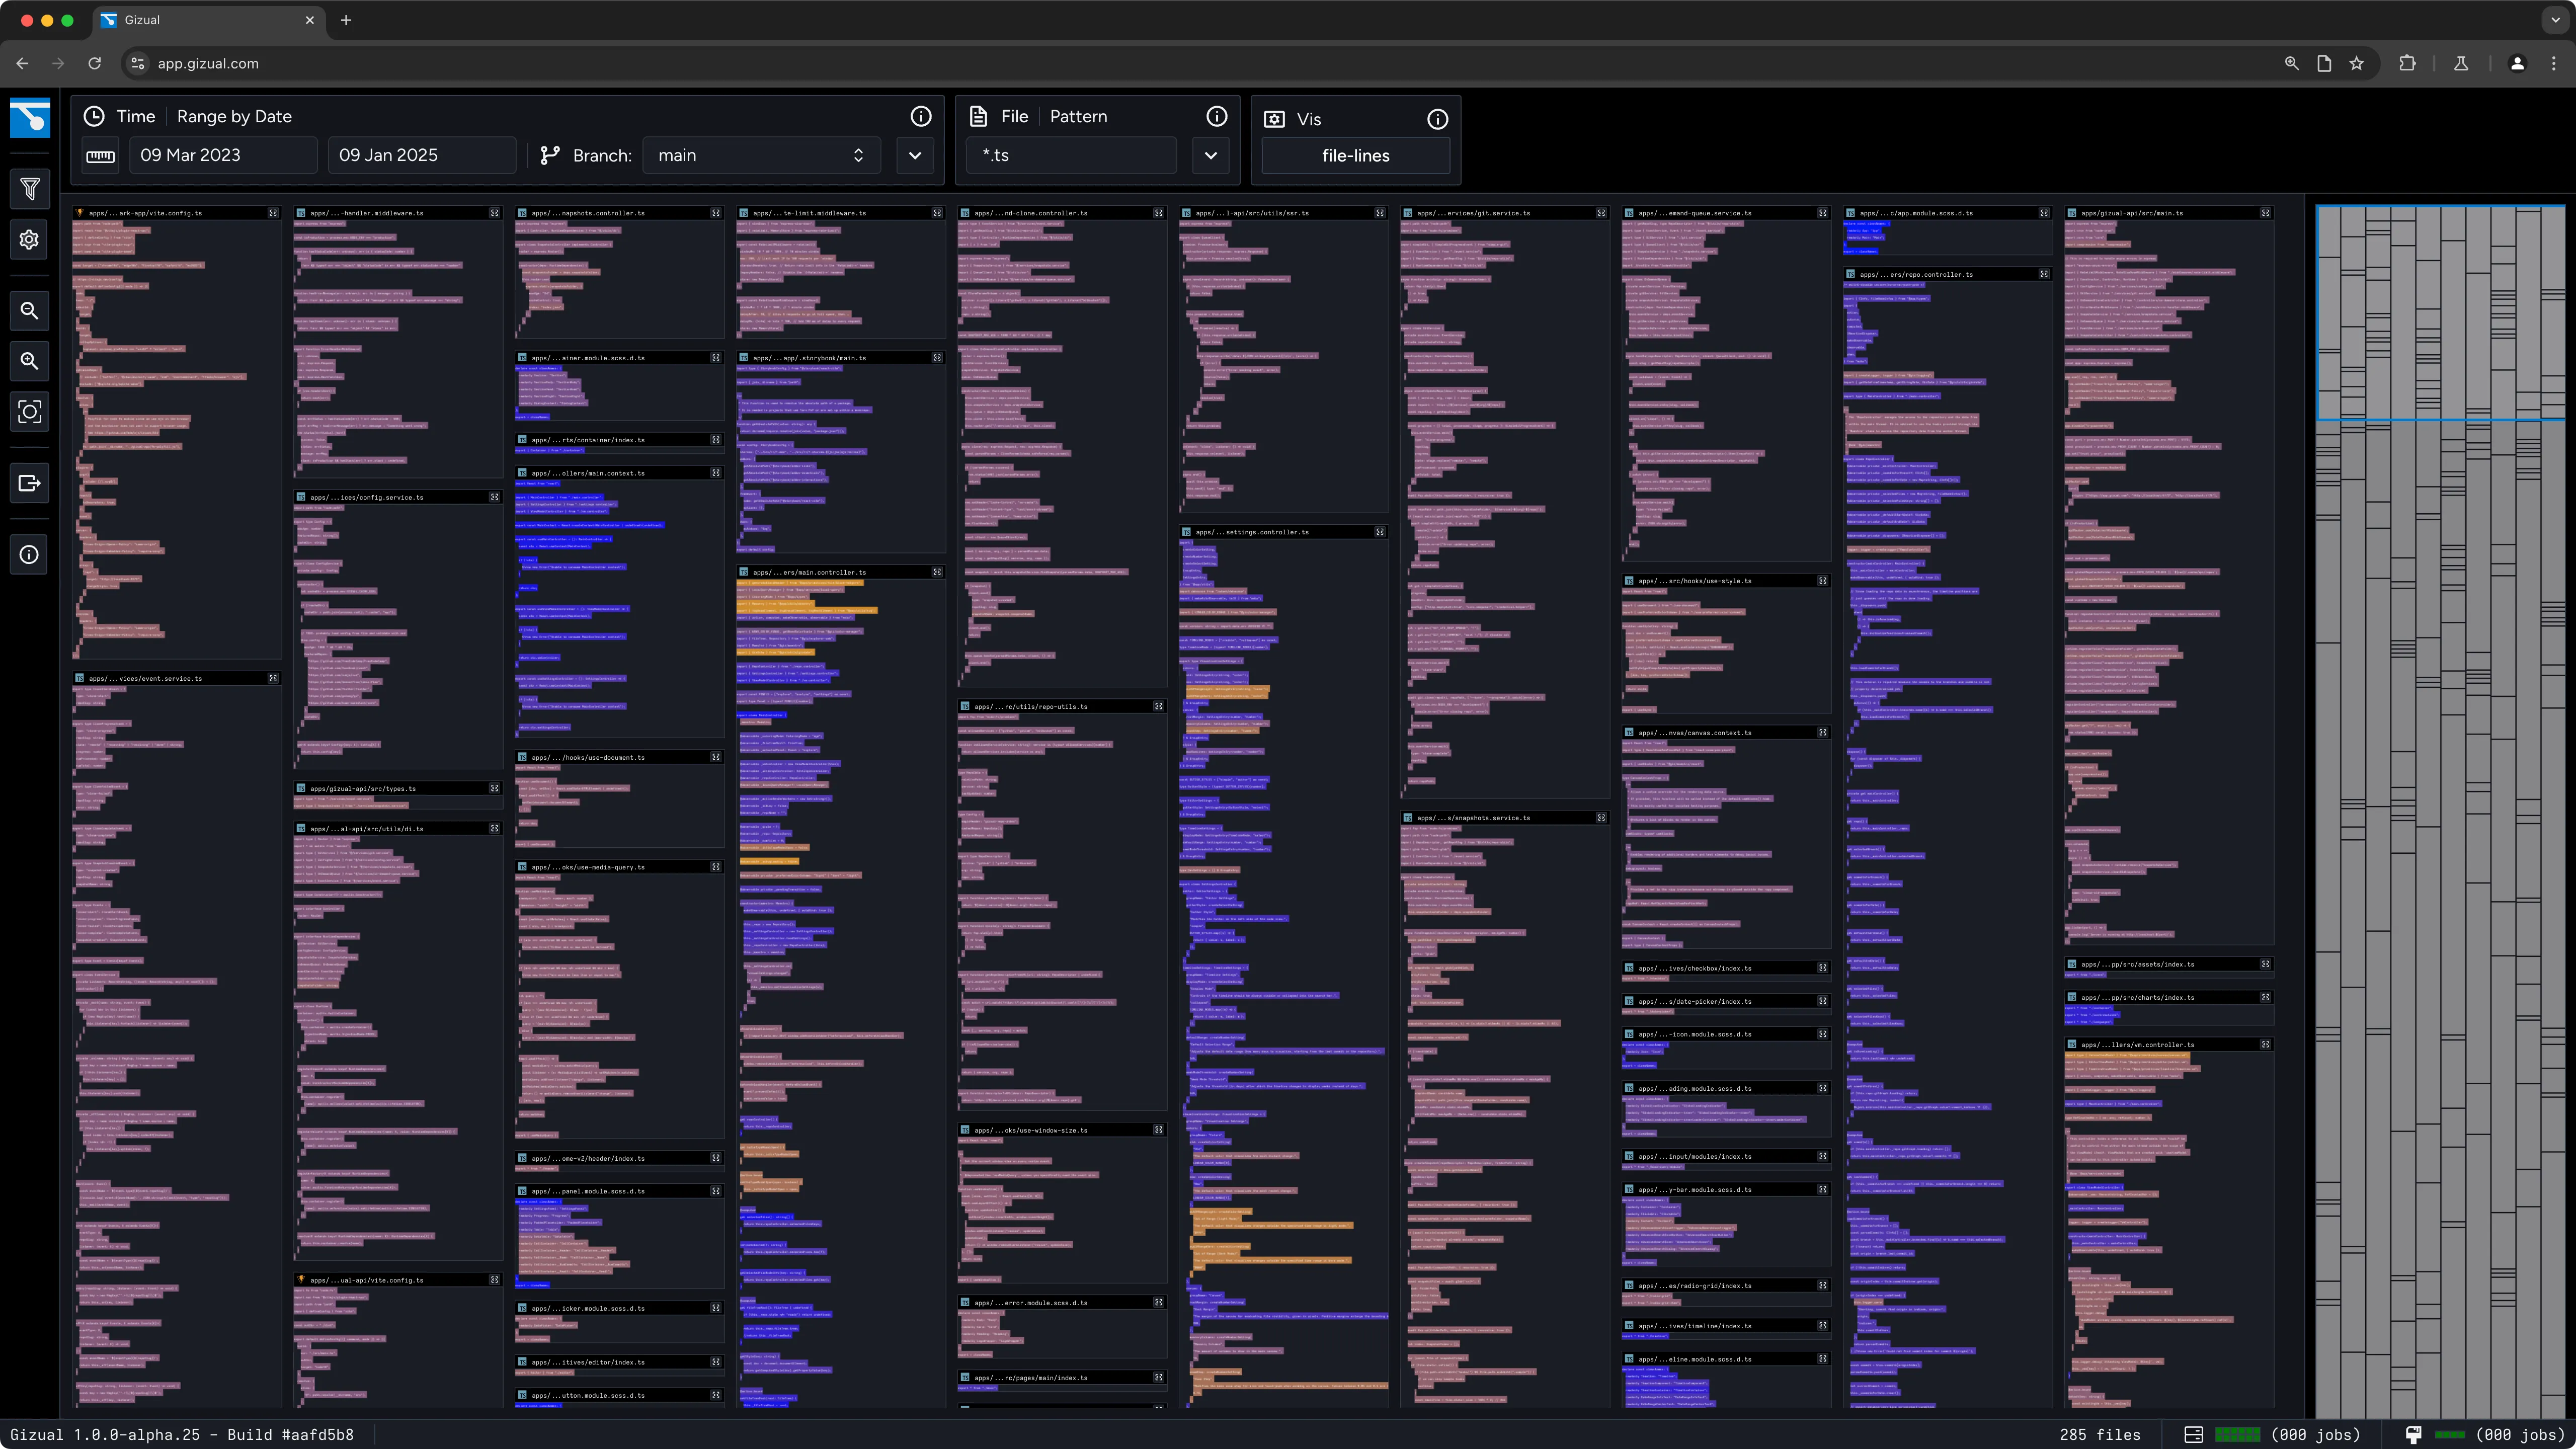
Interactive visualisations in multiple styles
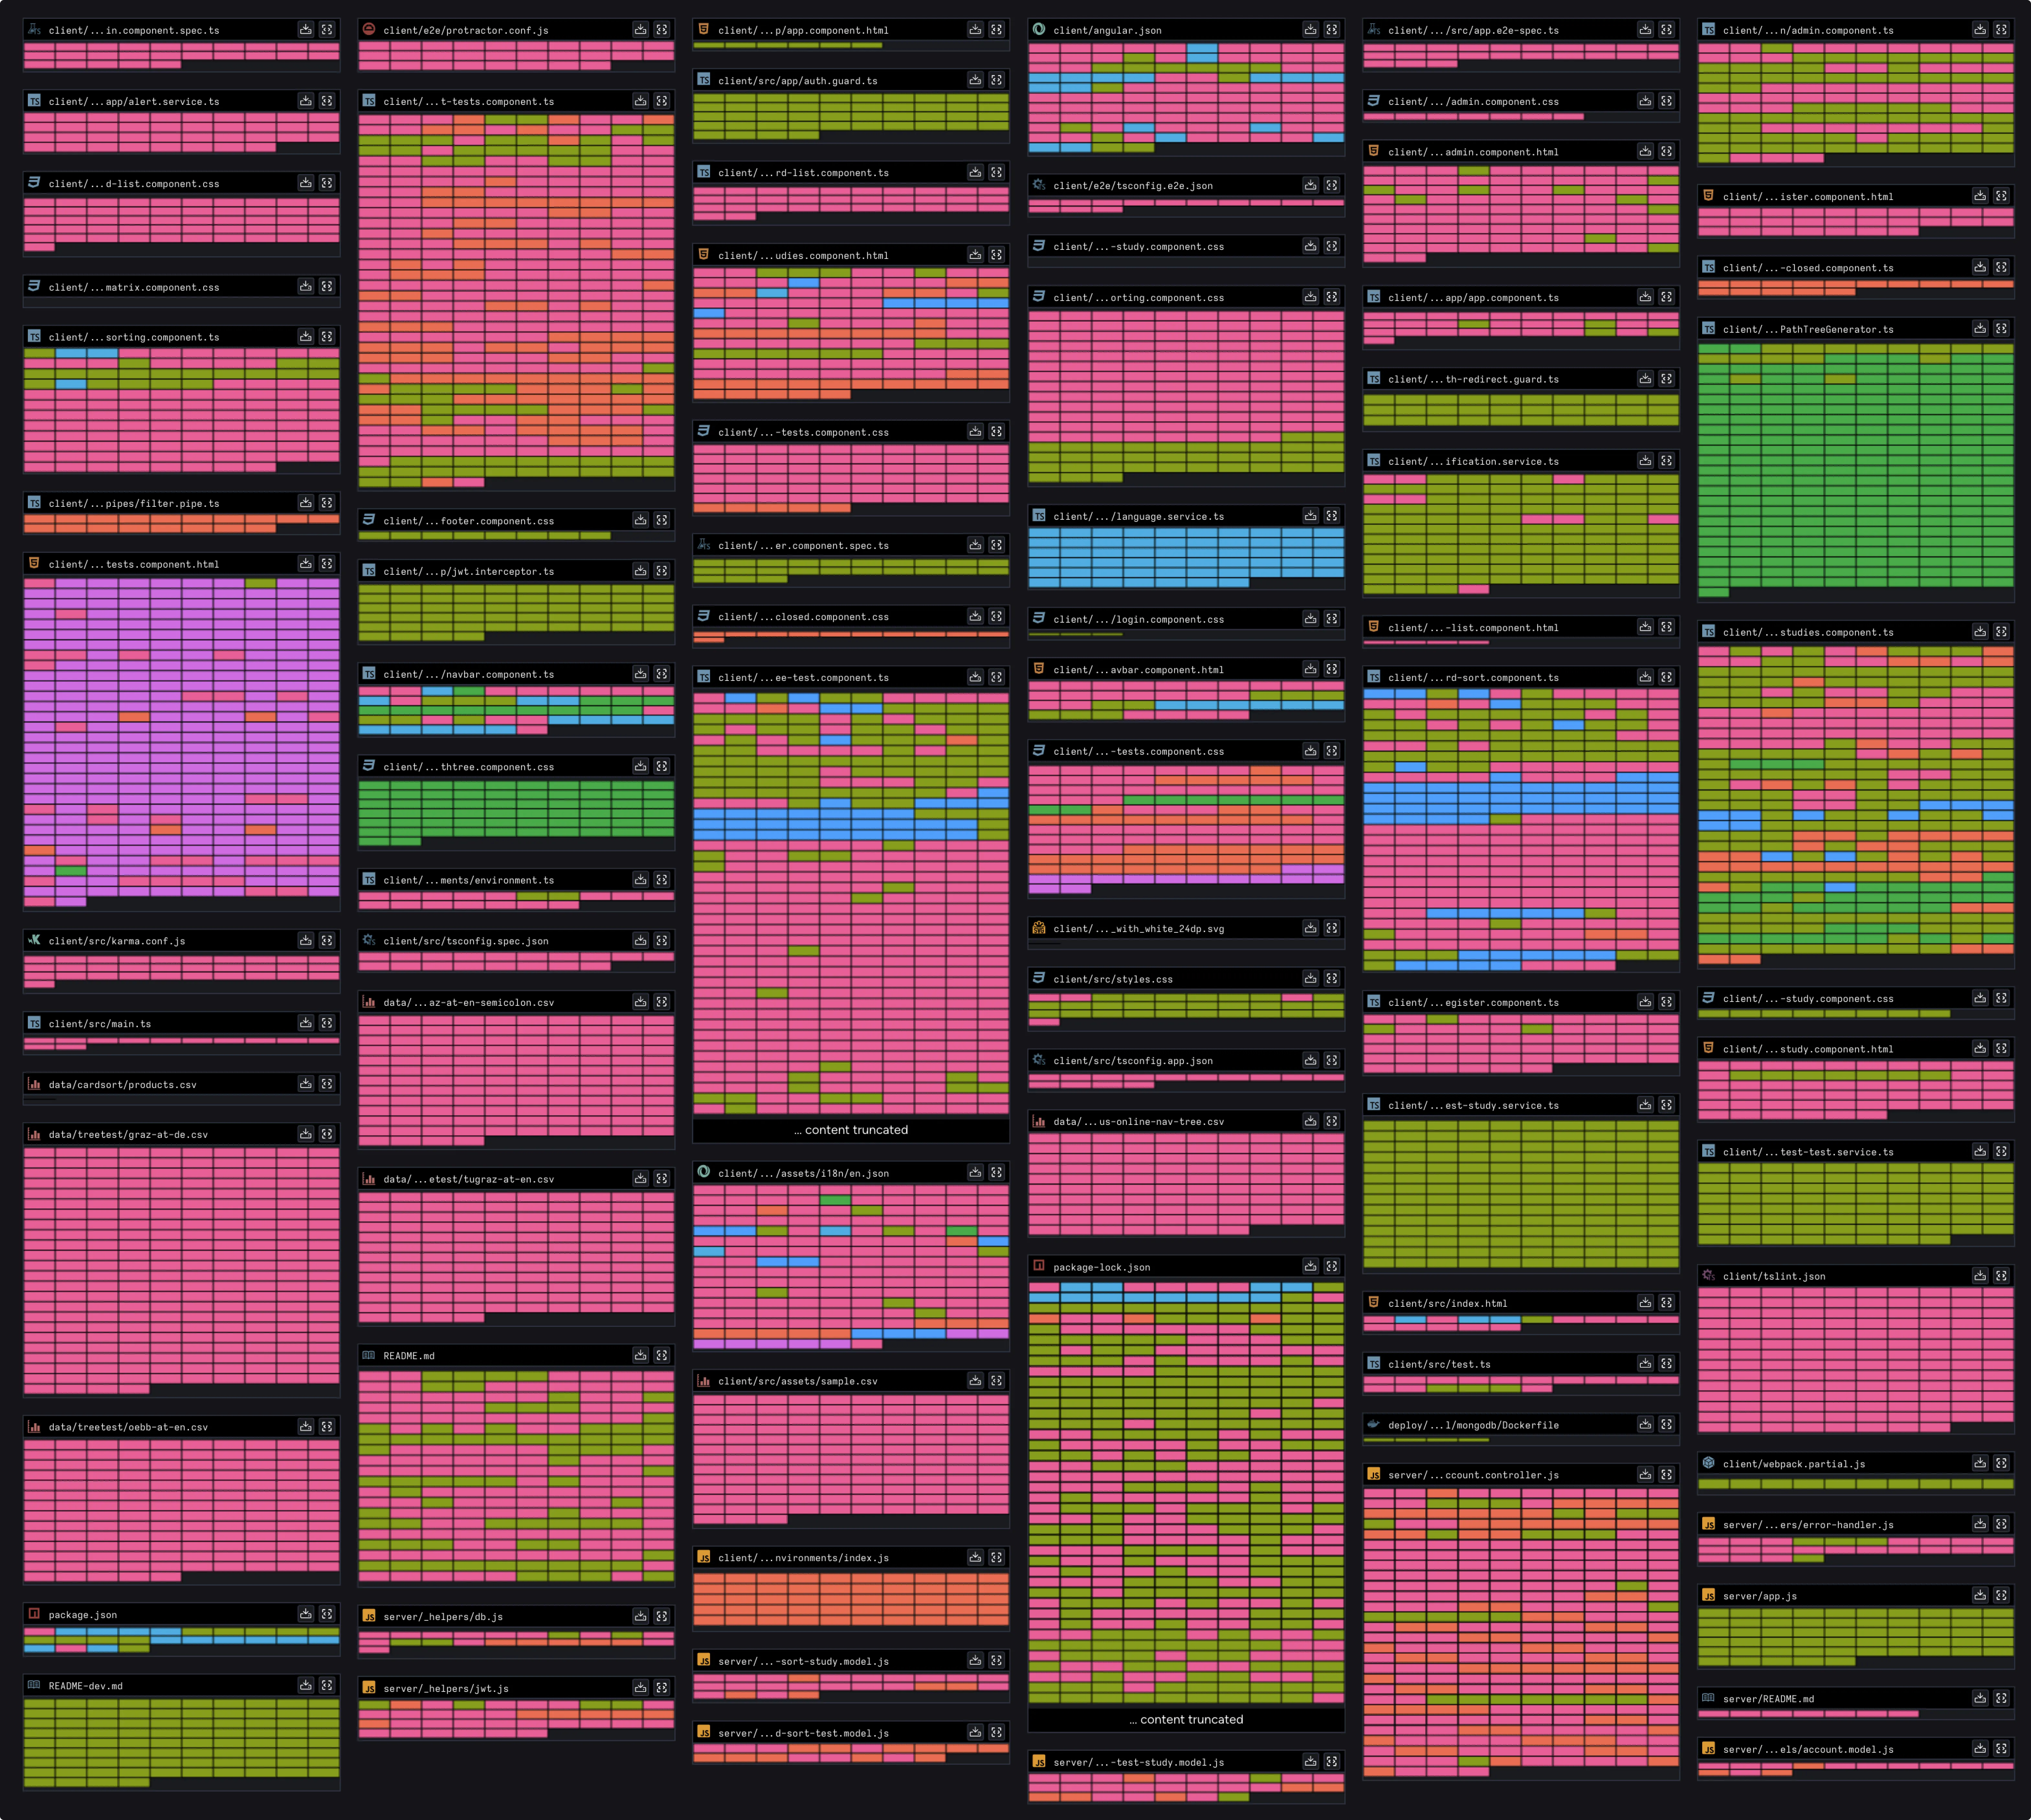
Dive into an (almost) infinitely zoomable canvas showcasing your repository's files. Each line is colour-coded based on a metric of your choosing, offering a unique historical perspective.- Zoom Zoom in to see individual lines of code or out to get a general overview.
- Pan Drag the canvas to pan around a large set of files.
- Pinch Pinch with two fingers on touch-devices.
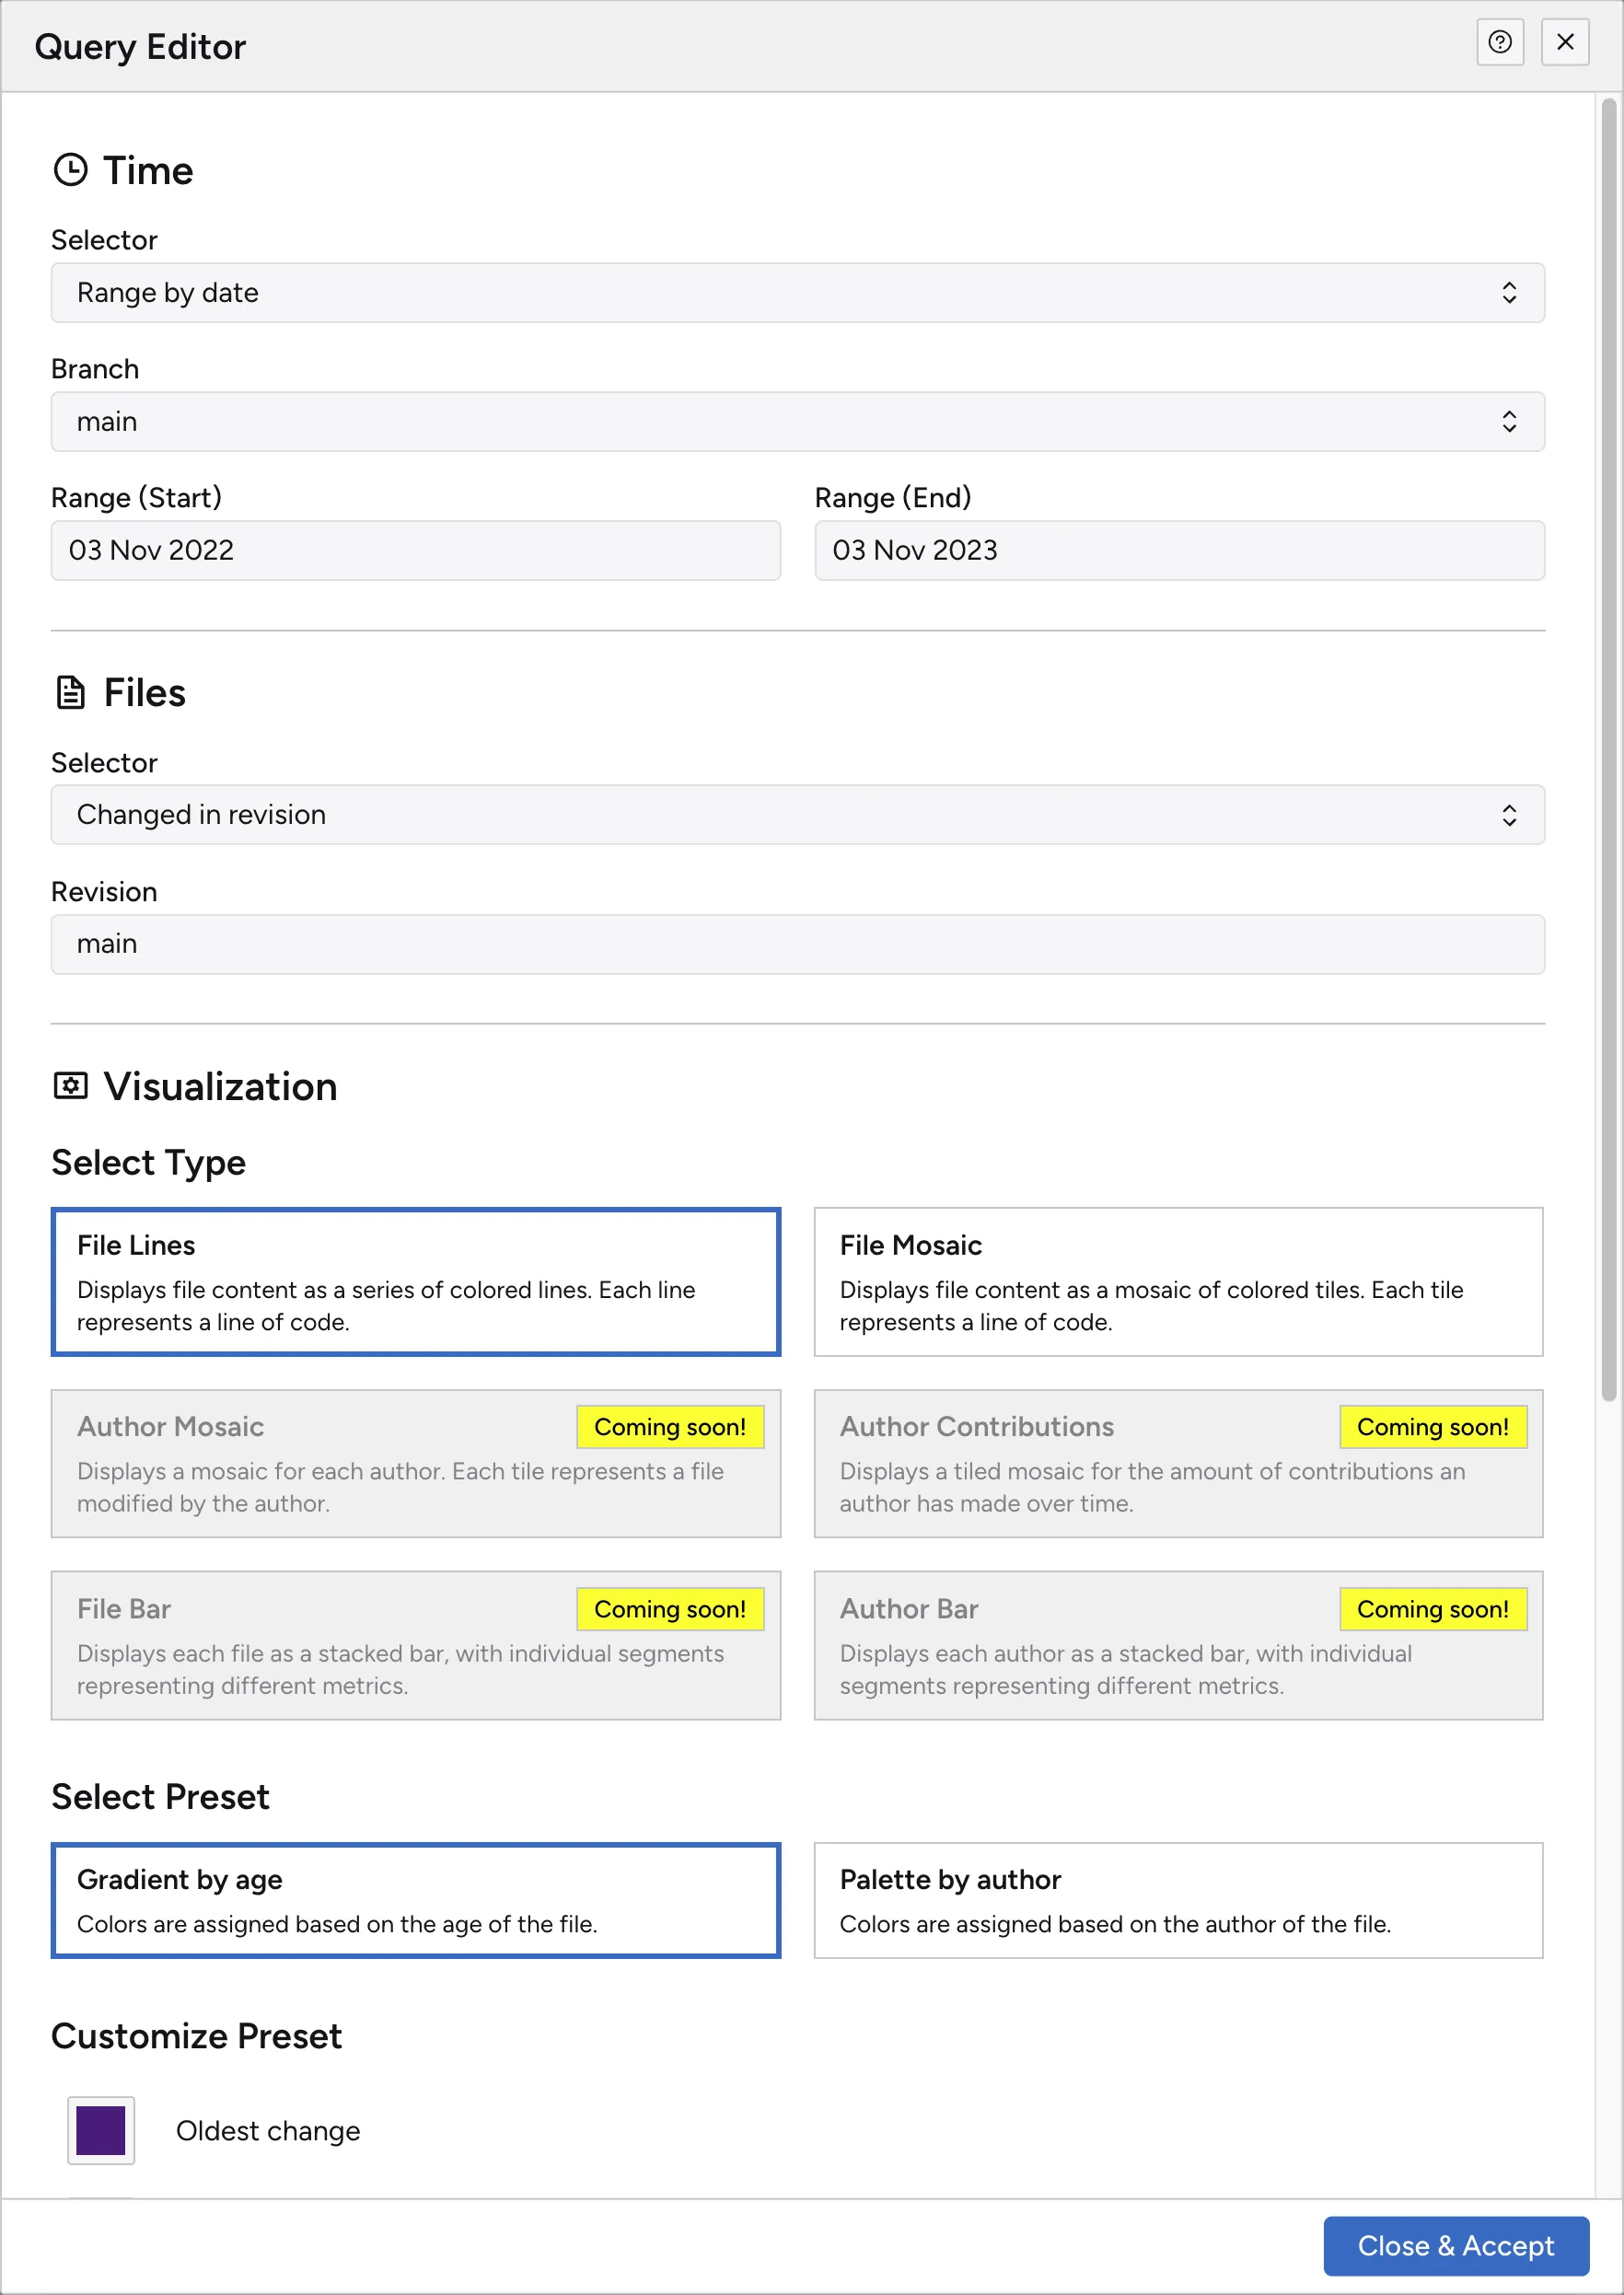
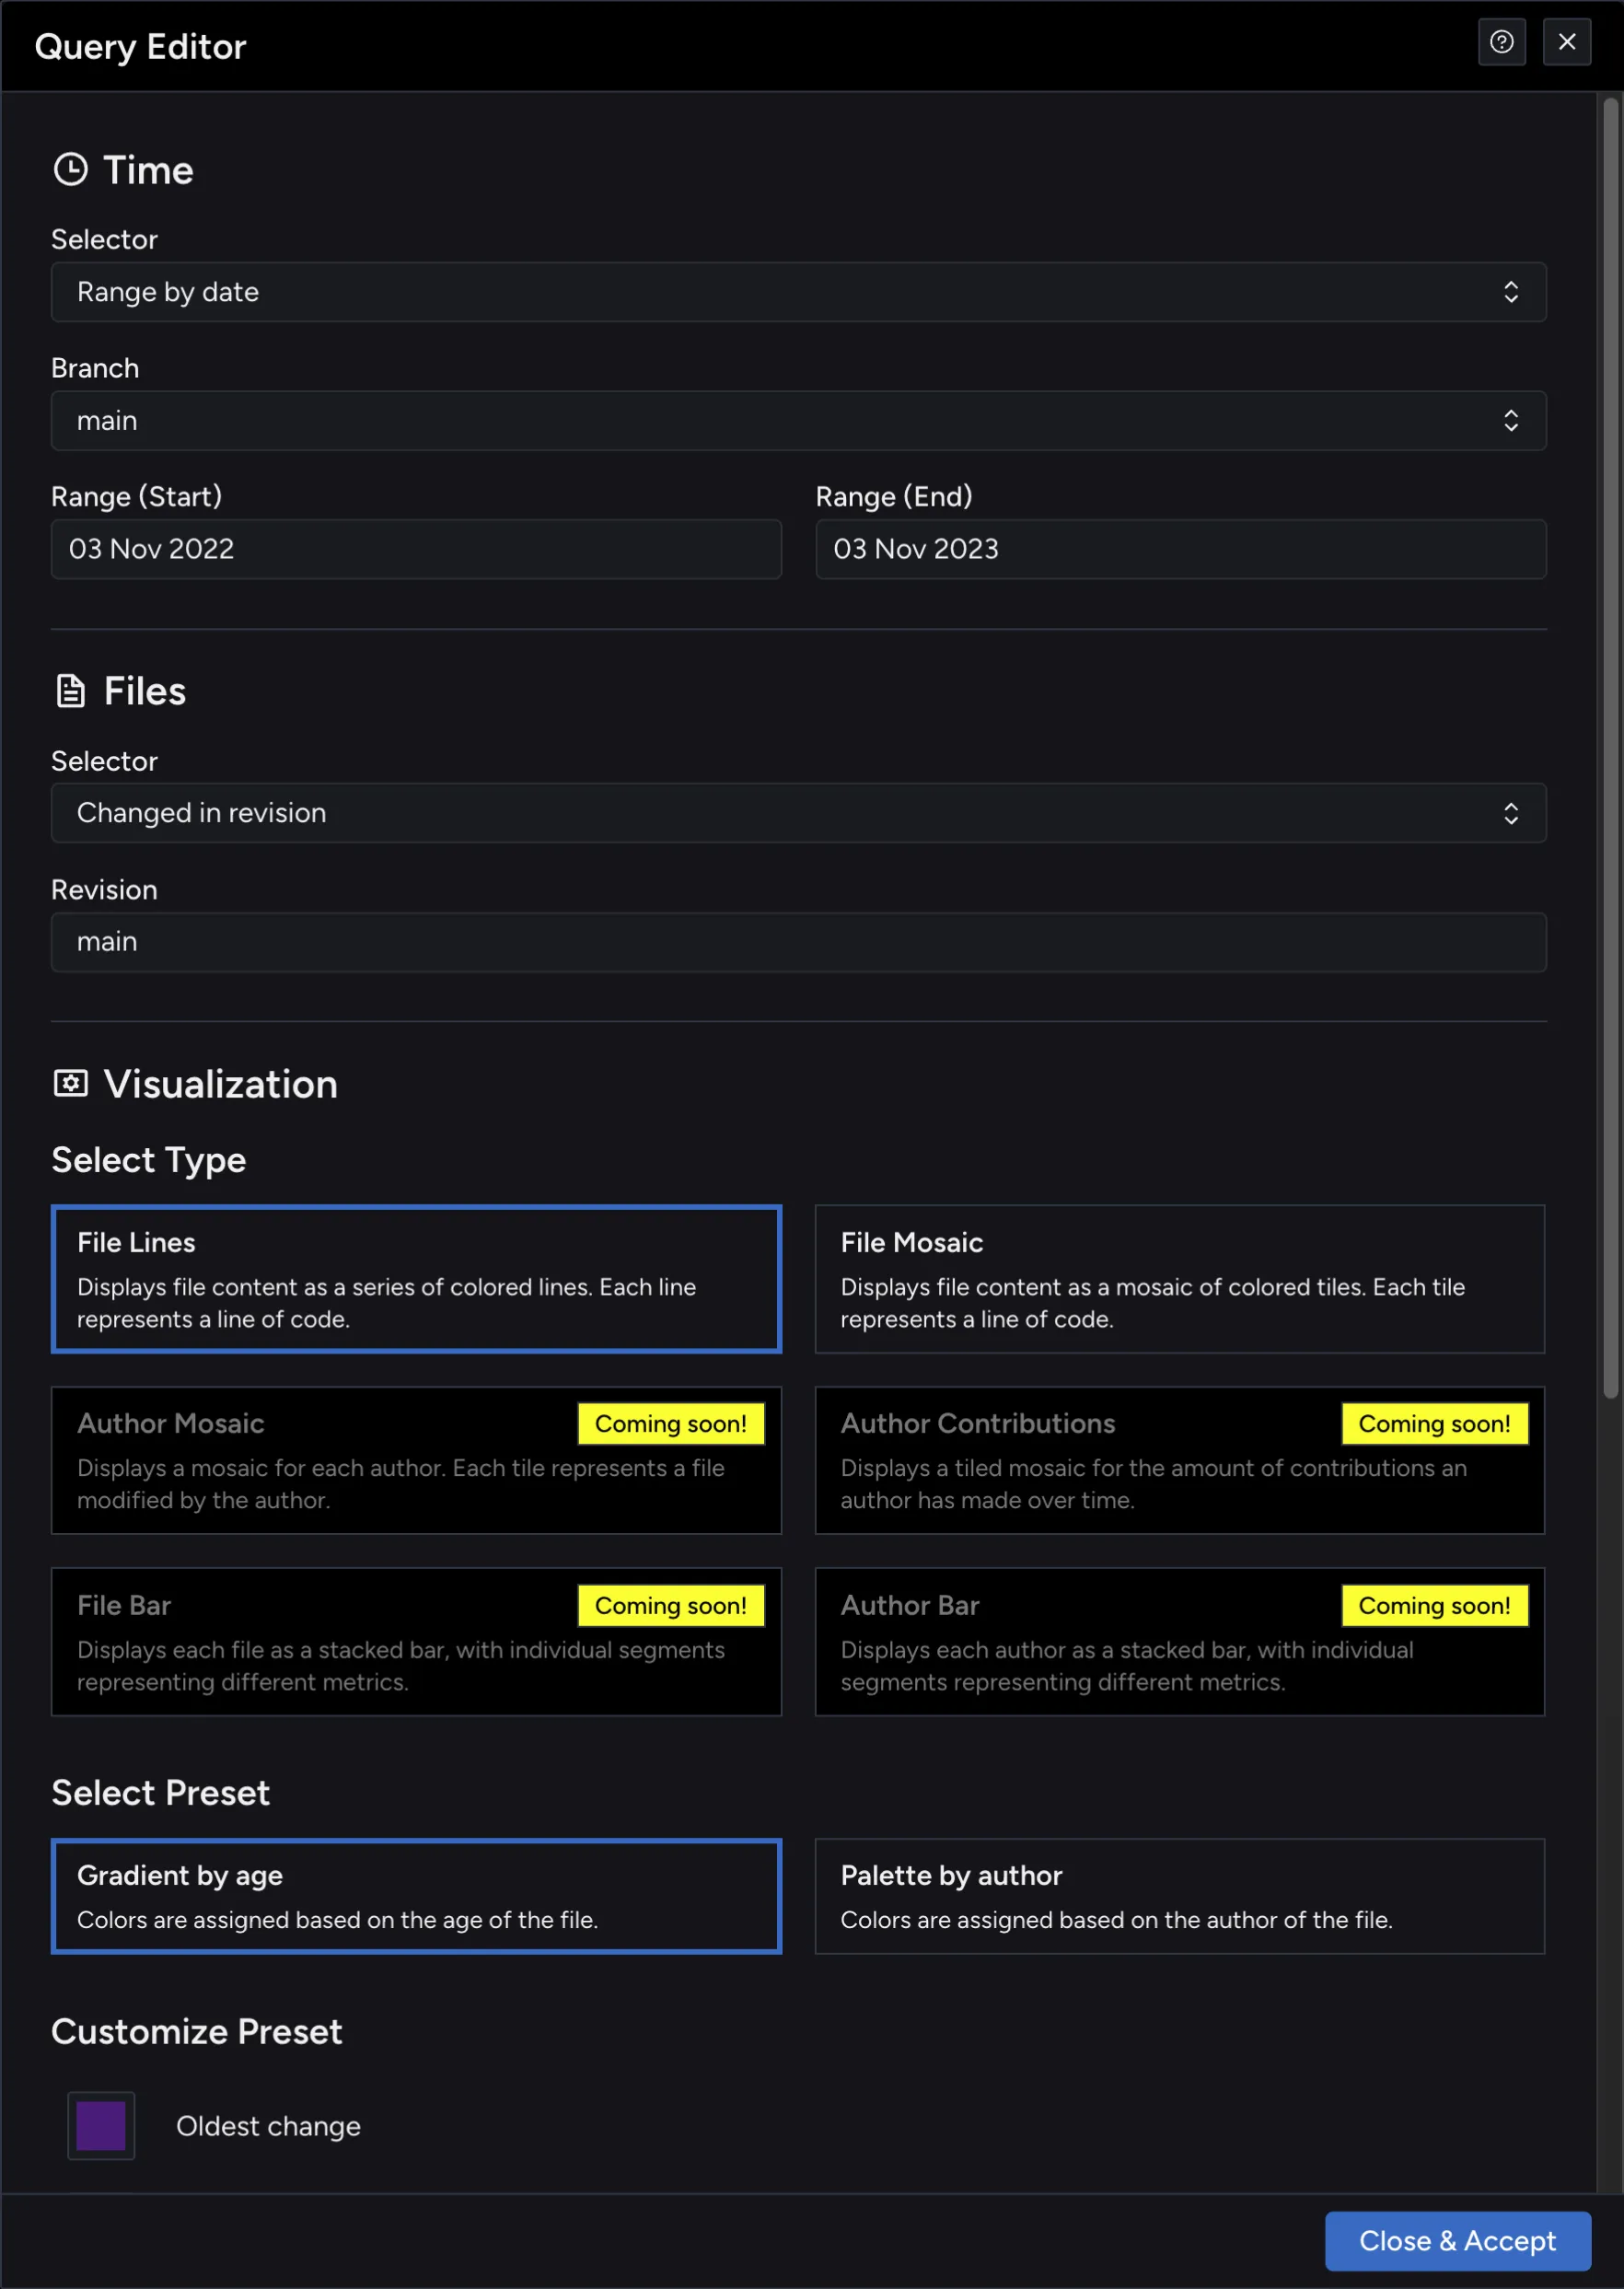
Custom queries for tailored analytics
Our built-in query allows you to filter the data you want to see. Special modules allow you to create complex filters with a few clicks.